The latest figures regarding divorce rate in South Africa indicate a continuing downward trend in the number of couples divorcing. Marriage and divorce information in South Africa is drawn from three main sources: population censuses, household surveys and government databases. Through this data, you will be able to get a complete picture of divorce in South Africa.
What is the divorce rate in South Africa?
The latest divorce rate in South Africa is 0.77 per 1000 people. This is the average crude divorce rate for all population groups in South Africa. This divorce rate is based on the latest annual total figures of 23,170 divorces. These statistics were published in 2021 and are drawn from census and household survey data from 2019.
This number is over 1,500 divorces lower than the previous annual total, resulting in a 6.2% decrease in the average divorce rate. The decreasing divorce rate in South Africa is a recent trend, coming after a decade-long increase in the number of couples breaking up.
What is the major cause of divorce in South Africa?
The major cause of divorce in South Africa is incompatibility. However, this isn’t the only reason why couples choose to end a marriage. After incompatibility, these are the most common reasons South African couples choose to divorce:
- Poor communication
- Infidelity
- Emotional problems
- Lack of spousal equality
Average divorce rate in South Africa
The average divorce rate in South Africa can be further broken down by age and population group. Additionally, South African divorce data shows the impact of children when it comes to divorce.
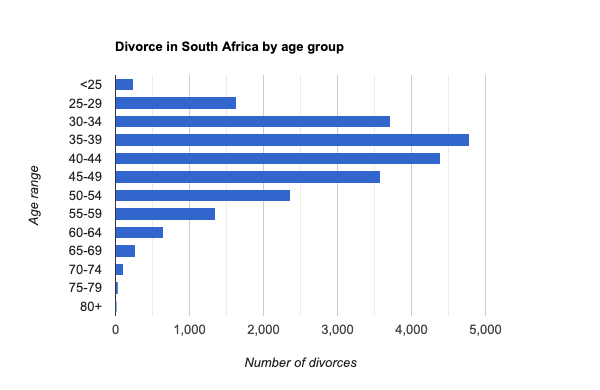
Average divorce rate by age
The median age of divorce in South Africa is 45 years old for men and 41 years old for women. The average divorce rate varies depending on age. The 35-39 age range has the highest share of total divorces in South Africa.
The highest average divorce rate by age in South Africa depends on how it’s measured:
- 35 to 39 year-olds lead with an average divorce rate of 0.082 per 1000 people, when looked at against the total population in South Africa.
- 40 to 44 years-olds beat other age groups with an average divorce rate of 1.22 per 1000 people when looked at against the population within the same age group.
| Age range | % of total divorce* | Crude divorce rate by total population | Crude divorce rate by population within respective age range |
| <25 | 1.05% | 0.004 per 1000 people | 0.05 per 1000 people |
| 25-29 | 6.92% | 0.028 per 1000 people | 0.3 per 1000 people |
| 30-34 | 15.67% | 0.063 per 1000 people | 0.67 per 1000 people |
| 35-39 | 20.16% | 0.082 per 1000 people | 1.02 per 1000 people |
| 40-44 | 18.50% | 0.075 per 1000 people | 1.22 per 1000 people |
| 45-49 | 15.13% | 0.061 per 1000 people | 1.20 per 1000 people |
| 50-54 | 9.95% | 0.040 per 1000 people | 0.96 per 1000 people |
| 55-59 | 5.69% | 0.023 per 1000 people | 0.64 per 1000 people |
| 60-64 | 2.72% | 0.011 per 1000 people | 0.38 per 1000 people |
| 65-69 | 1.16% | 0.004 per 1000 people | 0.22 per 1000 people |
| 70-74 | 0.46% | 0.002 per 1000 people | 0.12 per 1000 people |
| 75-79 | 0.13% | 0.0005 per 1000 people | Data not available |
| 80+ | 0.06% | 0.0002 per 1000 people | Data not available |
| Unspecified age | 2.40% | 0.010 per 1000 people | Data not available |
*The percentage rates of divorce may not add up to 100% due to rounding errors.
When looking at divorce rates by age range, the peak rate of divorce occurs between the ages of 30 and 54. Divorce becomes less common for people over 60, even when you account for the smaller population within the senior demographic.
Average divorce rate by ethnicity
The average divorce rate in South Africa varies by ethnicity. The highest percentage of divorces occur in couples where both spouses are Black African. Meanwhile, mixed-race couples have the lowest percentage of divorce.
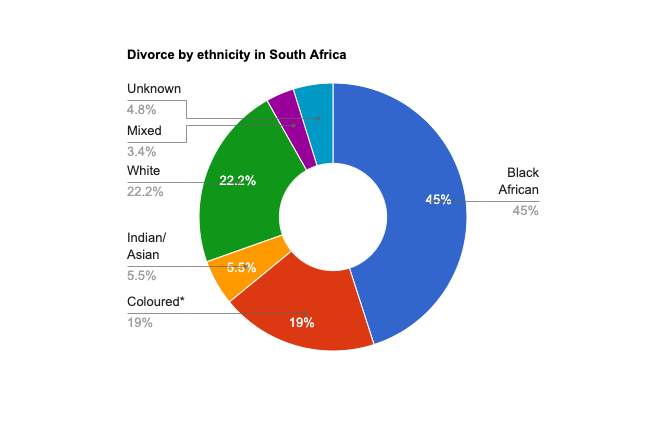
* Please read the section below to understand the use of this term in the context of South Africa.
The percentage breakdown of divorce by ethnicity shows that Black African couples initiate the majority of divorce proceedings. At the same time, the Black African average divorce rate is the lowest because Black African population represents the largest population group in South Africa.
The white population group has the highest average divorce rate by population in South Africa and the second highest percentage of total divorces.
| Population group | Total number of divorces | % of divorce total** | Divorce rate by population |
| Black African | 10,667 | 45% | 0.22 per 1000 |
| Coloured* | 4,502 | 19% | 0.89 per 1000 |
| Indian/Asian | 1,299 | 5.5% | 0.90 per 1000 |
| White | 5,268 | 22.2% | 1.19 per 1000 |
| Mixed | 816 | 3.4% | Data not available |
| Unknown | 1,148 | 4.8% | Data not available |
* Please read the section below to understand the use of this term in the context of South Africa.
** Percentages may not add up to 100% due to rounding errors.
Average divorce rate for interracial marriages
Interracial marriages result in the lowest amount of divorces with only 3.4% of divorces occurring between married interracial couples. The majority of those divorces are from couples who got married through a civil ceremony, as opposed to those who had a religious wedding.
Interracial marriage was banned in South Africa for several decades, due to Apartheid. Even after the ban was lifted, interracial couples still faced significant social pressure when considering marriage. South African interracial couples attribute overcoming disapproval and prejudice as contributing to stronger relationships in interviews with the BBC and DW.
While the South African Department of Statistics breaks down divorce information by population group, the same cannot be said for marriage numbers. However, the Institute for Justice and Reconciliation has calculated that the odds interracial marriage in South Africa have increased from 303:1 when interracial marriages began to occur, to 95:1 a decade later.

Average divorce rate for couples with children and without children
The average divorce rate in South Africa is higher for married couples with children. In the latest figures, 55.9% of divorces occurred in married couples with children. The South African government also provides a breakdown of divorce with and without children by population group.
| Population group | % of divorces with children** | % of divorces without children** |
| Black African | 60,9% | 39,1% |
| Coloured* | 63,0% | 37,0% |
| Indian/Asian | 51,9% | 48,1% |
| White | 44,1% | 55,9% |
| Mixed | 52,8% | 47,2% |
| Unknown | 42,9% | 57,1% |
| Total Population | 55,9% | 44,1% |
* Please read the section titled “How is ethnicity addressed in South African divorce statistics?” to understand the use of this term in the context of South Africa.
** Percentages may not add up to 100% due to rounding errors.
Same-sex marriages and divorce rates
The most recent same-sex divorce rate stands at 0.4 per 1000 people. This is lower than the average divorce rate in South Africa. The latest annual figures for same-sex married couples are: 174 divorces and 1,771 unions.
However, same-sex marriage is a relatively recent legal and civil rights development. This means that data on same-sex married couples is not as established as the data for heterosexual married couples.
FAQs about divorce rate in South Africa
Here are answers to common questions about divorce rates in South Africa.
What is the divorce rate in South Africa?
The current divorce rate is 0.77 per 1000, according to the Department of Statistics of South Africa.
How is the divorce rate calculated?
Divorce rate is calculated by dividing total annual divorces by the yearly average of a specific overall population. For a crude divorce rate (CDR), the population is the total national average or total population mid-year.
For a refined divorce rate (RDR), the annual divorce total is divided by total married women. This method is often preferred since it better accounts for age demographics. However, this method does not accurately represent same-sex divorce trends.
Both divorce rate calculation methods generally express results in the form of the number of divorces per 1000.
Why has the divorce rate increased in South Africa?
The average divorce rate in South Africa is decreasing. The overall divorce rate trend is a downward one, after being on the rise for over a decade.
What professional sector has the highest divorce rate?
The professional sector with the highest divorce rate for men is the service sector with 14.2% of divorced men. For women, it’s the skilled labour category with 14% of divorced women. However, all occupational category divorce rates are lower than those for unemployed people which are currently 17.4% and 24.3%, for men and women respectively.
South African divorce rate: final thoughts
While divorce rates are waning, the impact of a marriage breaking up on spouses and children is no less significant. The data on this page provides insight into societal aspects of divorce but not the personal consequences or how to move on. Our guide on what comes after divorce has advice on the steps you can take to help you with what comes next.